QUAD-G Meter is an iPhone app for practising smoother braking, cornering and acceleration by visualising weight transfer (load transfer). See estimated loads at all four wheels, longitudinal and lateral G, and a G-G diagram using your iPhone’s sensors and GPS. No extra hardware is needed. The Premium data logger lets you replay G traces after a run to review how your inputs connect.
Wheel loads are estimated from G and vehicle settings. Practise in closed environments such as race tracks, and do not watch the screen while driving.
Last updated:

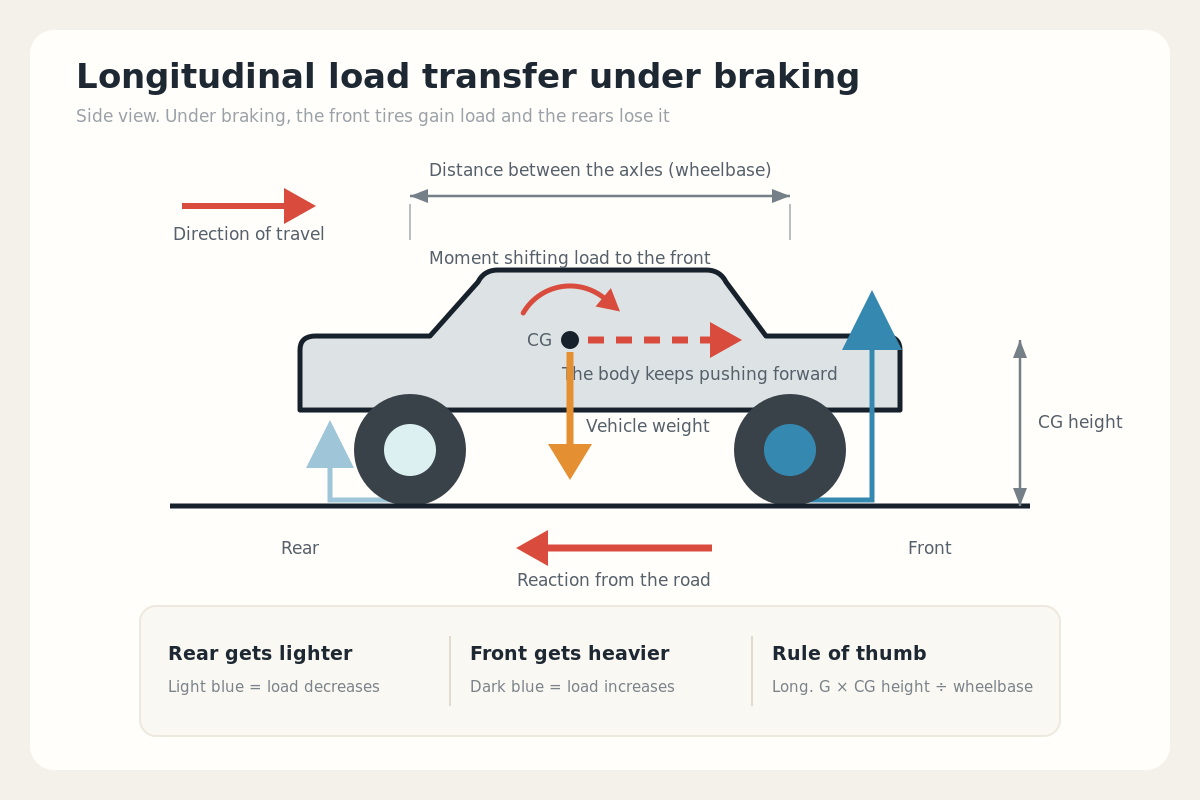
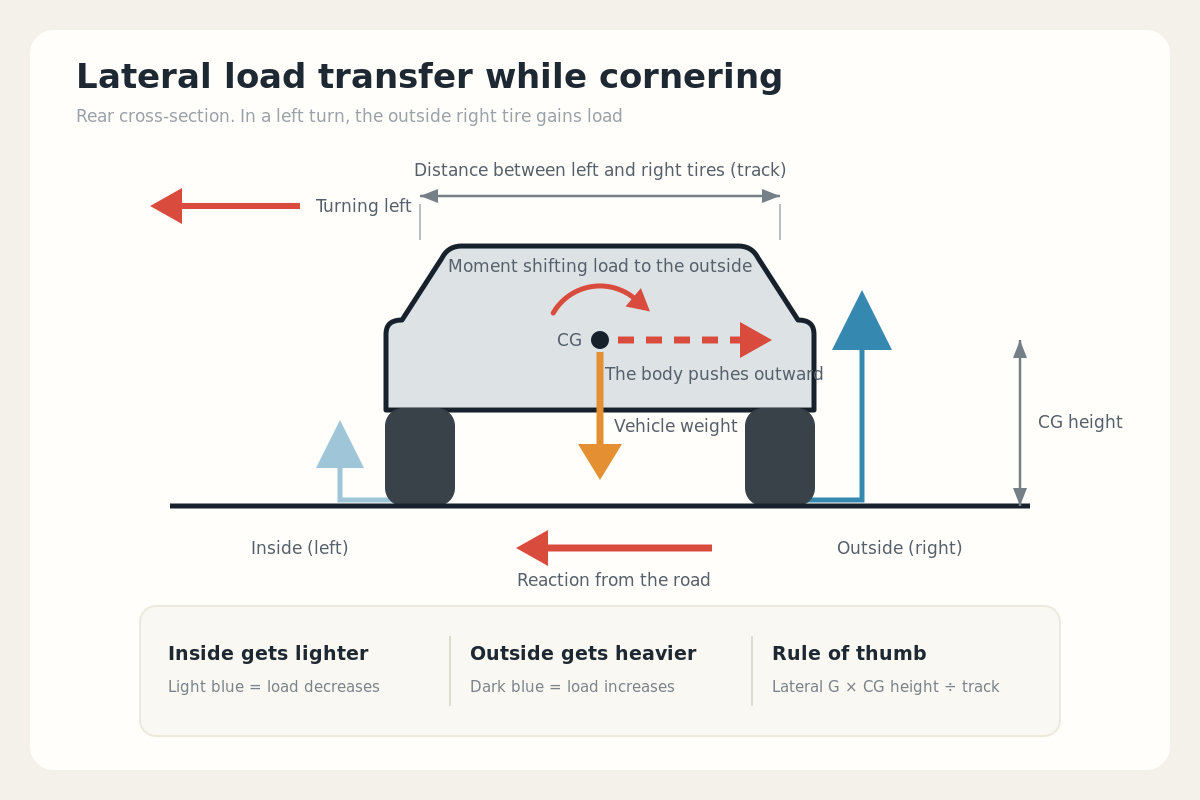
Load transfer is the shift of the car’s weight between the four tires whenever you accelerate, brake, or corner. Braking moves load forward, accelerating moves it rearward, and turning right moves it to the left (outside) tires. The car doesn’t get heavier or lighter — the same total weight is simply redistributed.
In a real car, front/rear track widths, sprung/unsprung mass, and suspension characteristics also affect how load reaches each wheel.
There is a ceiling on the force a tire can pass to the road. Cornering force and accelerating/braking force all come from a contact patch about the size of your palm. The classic way to draw that ceiling is the friction circle.
Braking/accelerating force and cornering force don’t act separately — they act on the tire as one combined force. When that resultant reaches the rim of the circle, the tire has nothing left. That’s why the harder you brake, the less grip remains for turning — and why a car barely turns under full braking.
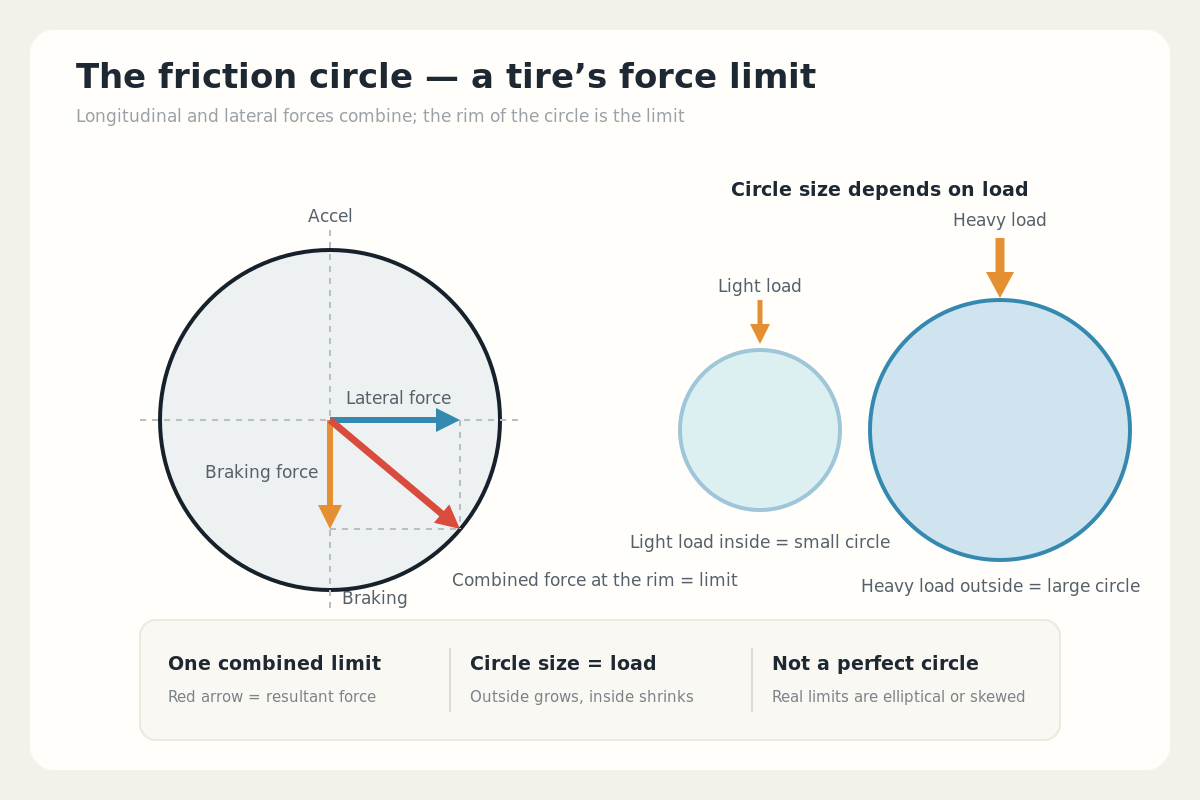
The radius of the friction circle — the force ceiling — is set by the vertical load on that tire. When load transfers, the outside circle grows and the inside circle shrinks. But the radius does not grow in proportion to load, so the outside tire can’t fully make up what the inside tire loses. The more load transfer, the smaller the four circles add up to.
Real limits are not perfect circles. Tires produce different peak forces longitudinally and laterally, and load, camber, surface, and slip all reshape the boundary into an ellipse or a skewed oval.
Understeer and oversteer describe how much the car actually rotates compared with how much you steer. The same corner can produce either, because the load distribution changes moment to moment with how you drive. The load transfer we’ve covered so far feeds directly into these two behaviors.
You add steering, but the car doesn’t turn as much as you asked. Near the limit, it usually means the front axle ran out of cornering margin first.
The car’s rotation matches your steering almost exactly. The front and rear axles are using up their margins at about the same rate.
The car rotates more than you steered and the rear moves outward. Near the limit, it usually means the rear axle ran out of margin first.
The key is a tire property called load sensitivity. Grip rises with load, but not in proportion — double the load does not give you double the force. So when a left/right load difference builds up, the inside tire loses more than the outside tire gains, and that axle’s combined grip shrinks. Every time load moves, the ratio of front-axle to rear-axle lateral force capacity changes — and understeer or oversteer is what you feel when that ratio tips far enough that one axle runs dry first.
| Situation | Where the load goes | Likely tendency |
|---|---|---|
| Braking corner entry | Front tires gain load, rears lose it | The rear axle’s lateral ceiling drops and the rear slides outward more easily — toward oversteer. This is why cars rotate willingly on entry. |
| Accelerating corner exit | Rear tires gain load, fronts lose it | The front axle’s lateral ceiling drops and the car runs wide — toward understeer. |
| More lateral transfer on the front axle | Bigger inside/outside difference at the front | Load sensitivity shrinks the front axle’s combined grip — toward understeer. |
| More lateral transfer on the rear axle | Bigger inside/outside difference at the rear | Same mechanism at the rear — toward oversteer. |

Under power, load transfer isn’t the whole story. In a powerful rear-drive car, the rear tires can spend so much grip on traction that the car moves toward oversteer — as the friction circle showed, longitudinal and lateral force trade against each other.
A g-meter (g-force meter) displays the car’s longitudinal and lateral acceleration in units of G. A G-G meter (G-G diagram) records those two axes on one plane — longitudinal G vertical, lateral G horizontal — plotting the combined point at each instant. The farther a point is from the center, the more G the car was pulling at that moment.
They look alike, but the friction circle describes one tire’s limit, while a car’s G-G plot is the whole vehicle’s reachable range — four tires, drivetrain, brakes, and aero combined. You cannot overlay a single tire’s limit line onto the whole car. Banked roads can stretch the lateral range, and the acceleration side is capped by engine or motor power.
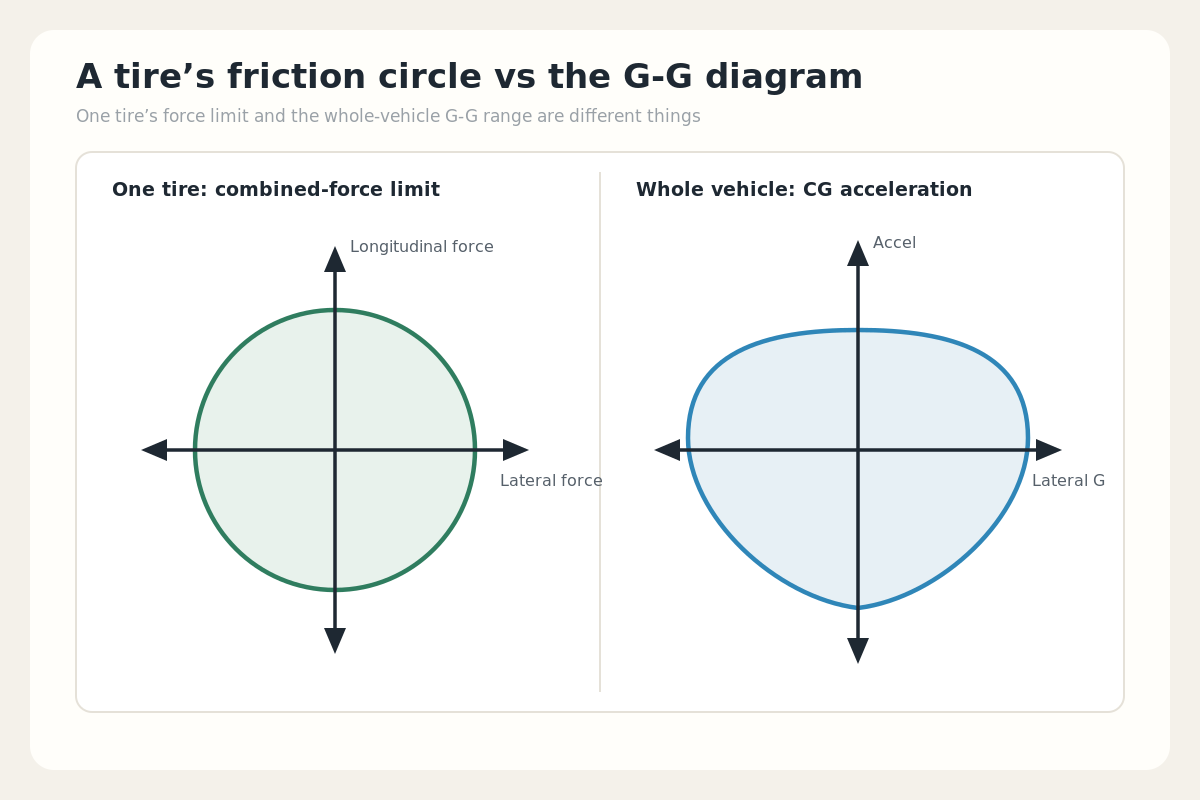
At low speed, the driven tires’ grip, load transfer, and drivetrain layout tend to set the acceleration limit; at high speed, engine/motor power and aerodynamic drag dominate. In the power-limited region, drive force is roughly power ÷ speed, so acceleration G falls as speed rises. Braking can use all four tires — friction brakes on top of any regeneration — so braking G usually exceeds pure acceleration G.
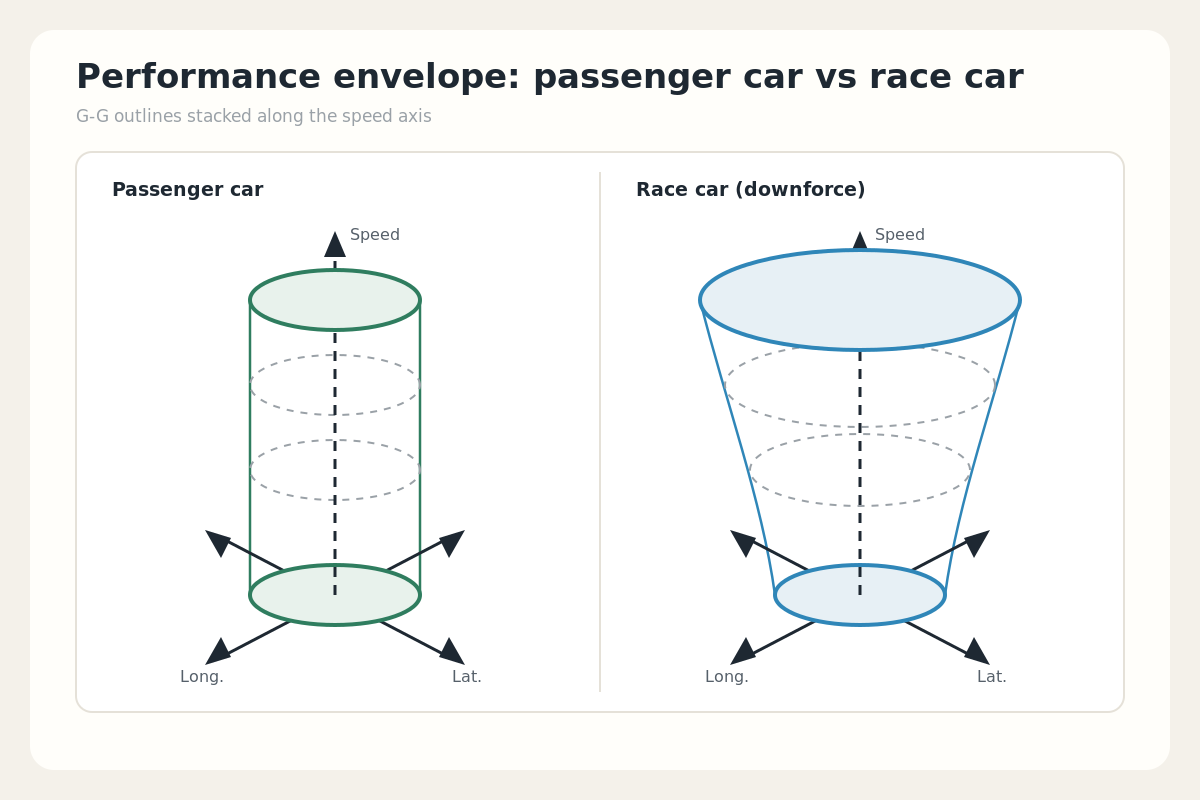
In an ordinary road car, aerodynamic load changes little with speed, so the G-G shape stays roughly the same size. In a downforce car, the lateral and braking ranges grow as speed rises. Stacking G-G outlines along a speed axis gives a 3-D solid — the performance envelope.
SYNSETECH LTD / English & Japanese
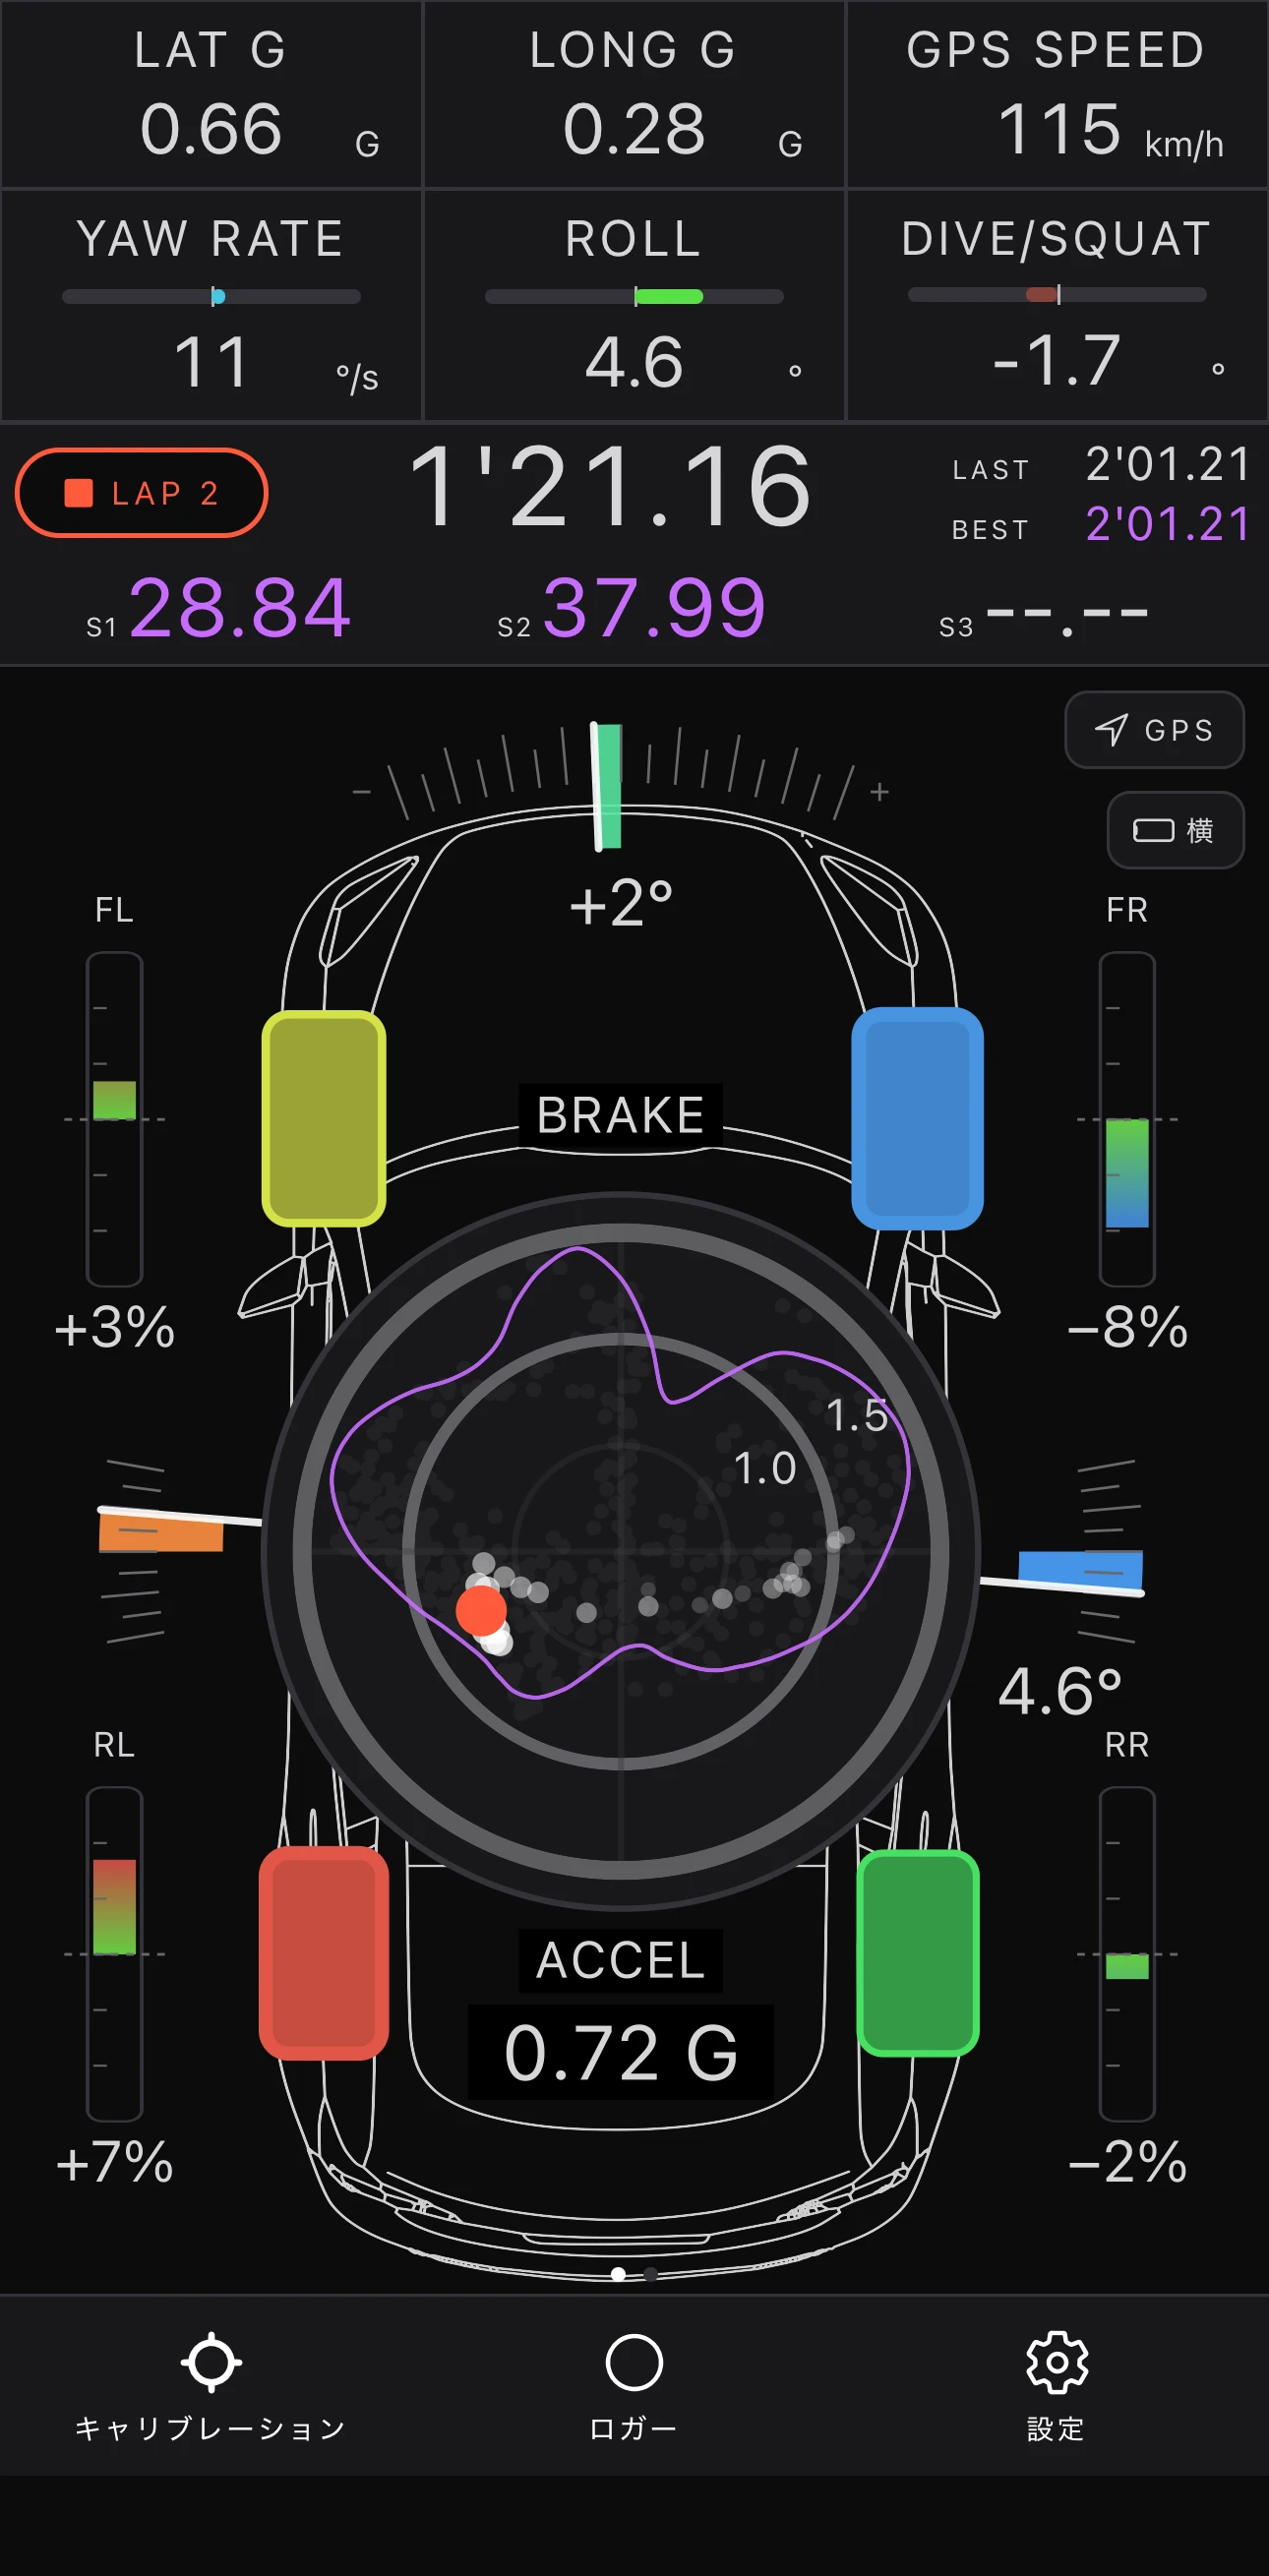
QUAD-G Meter lets you watch everything on this page — load transfer, the G-G diagram, body attitude, and transient understeer/oversteer tendency — in your actual driving. It works as a g-meter (g-force meter) showing longitudinal and lateral G, while displaying the estimated load on all four tires at the same time. It uses the iPhone’s motion sensors and GPS, so no OBD adapter or external sensor is required. G, angular rate, and attitude come from the device sensors; the four wheel loads are estimated from your vehicle’s specs and the measured G.
Estimated load on each of the four tires, shown in the four corners. Colors and numbers show how braking, accelerating, and cornering redistribute the load.
Plots the combined lateral/longitudinal G point, overlaying the path you drove (trail) and the outer boundary reached in the session (envelope).
How far the body leaned left/right and pitched forward/back under cornering and braking.
From the time evolution of lateral G, yaw rate, and speed, the app flags understeer-ward and oversteer-ward tendencies with color and audio.
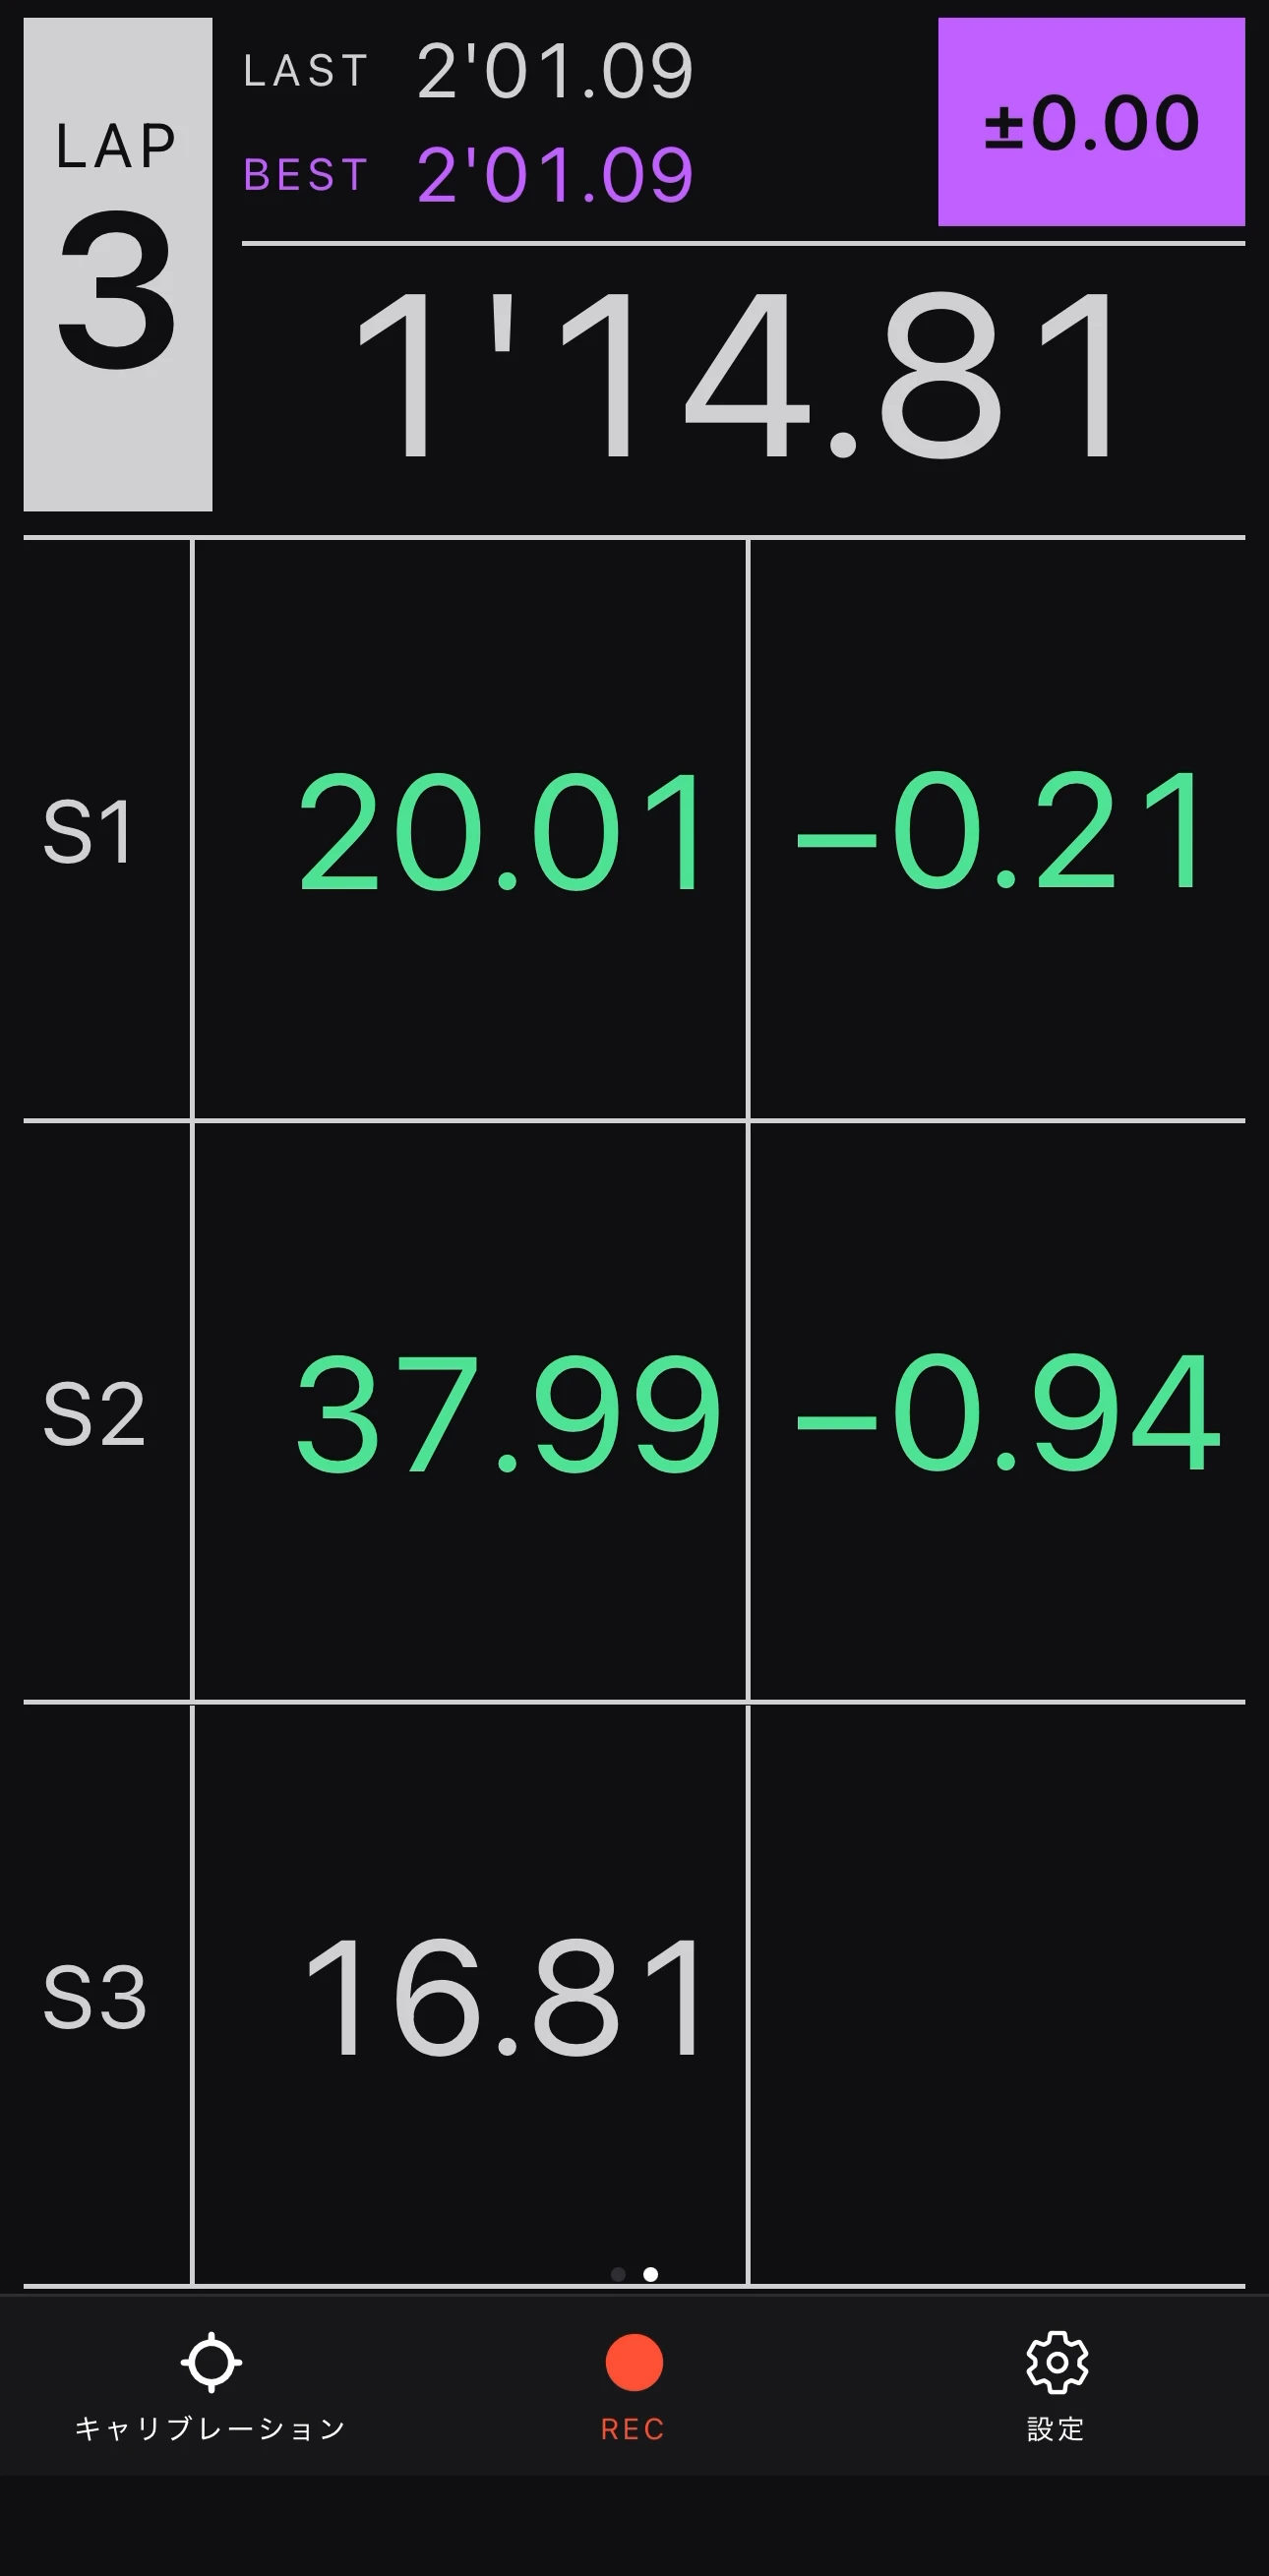
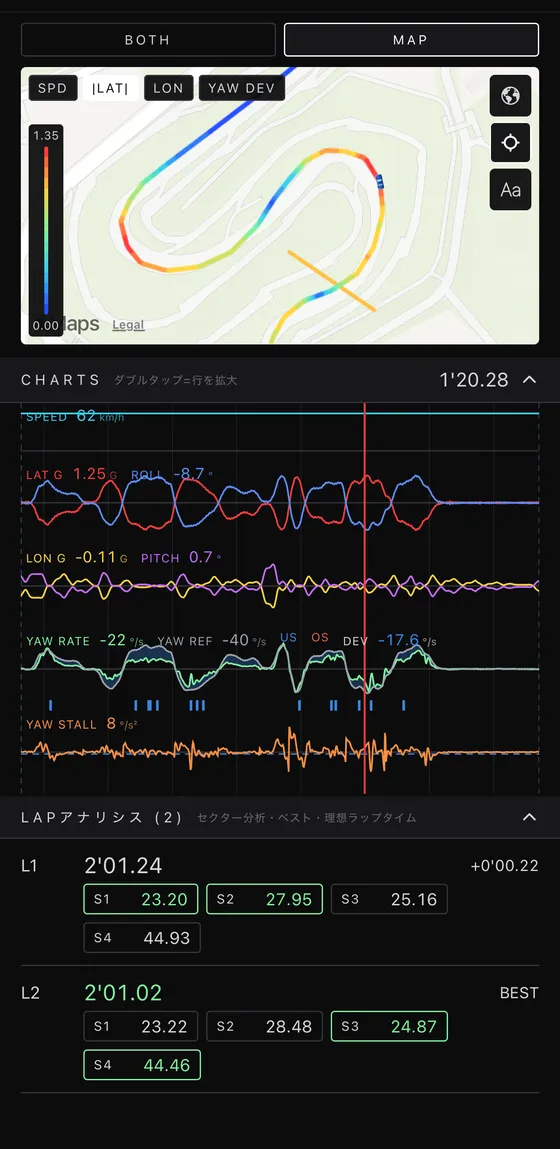
Beyond the four-wheel loads, G-G meter, roll, and understeer/oversteer indication covered above, the app records and times your driving.
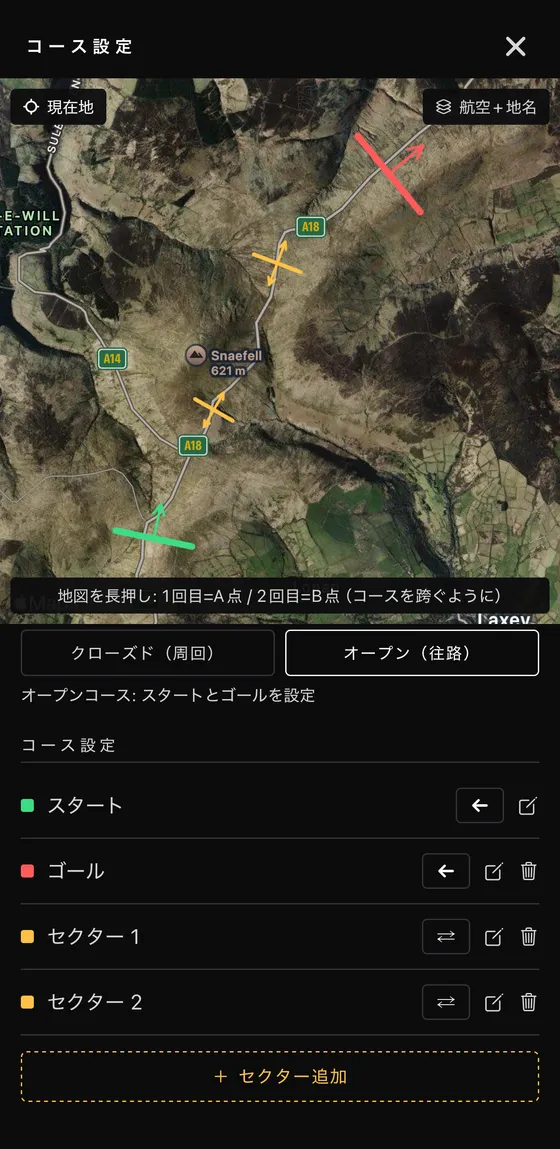
Long-press the map to place start/finish and sector lines. Build courses anywhere in the world — not just circuits — with both closed-loop and point-to-point timing.
Current time, lap count, LAST, BEST, delta to best, and sector times in large, readable type. Tap to switch between sector-delta, cumulative-delta, and time-focused layouts.
A speed-colored course map, time-series charts of G, yaw rate, and attitude, and the G-G diagram — all synchronized to a single playback cursor.
Recorded sessions export as CSV, ready for any external analysis tool.
Themes and accent colors, numeric column items, gauge ranges, load units (% / kgf), and drawing rate.
No account, no login. Recordings are stored on the device and never leave it unless you share a CSV yourself.
| Plan | What you get |
|---|---|
| Free $0 | Real-time four-wheel load monitoring, G-G meter, yaw rate, and roll/pitch. |
| Premium one-time purchase US$4.99 (Japan ¥500) | GPS lap/sector timing, data logger & viewer (CSV export), understeer/oversteer alerts, and display customization. One payment — no subscription, no auto-renewal. |
Prices may vary by country, region, and exchange rates. Check the App Store for the current price.
iOS. An Android version is in development and coming soon.
QUAD-G Meter is an iPhone app from SYNSETECH that supports weight transfer practice. It uses the iPhone’s sensors and GPS to obtain longitudinal and lateral G, then calculates estimated wheel loads from vehicle settings and shows a G-G diagram. It helps you understand load changes during braking, cornering and acceleration without an OBD adapter or extra sensors.
QUAD-G Meter Premium includes a data logger and viewer. Replay a recorded run with synchronised maps, G, yaw-rate and attitude charts, and a G-G diagram to review transitions from braking to cornering and acceleration. The data logger is not included in the free version.
Braking, accelerating and cornering redistribute the car's weight between the four tires: forward under braking, rearward under acceleration, and onto the outside tires in a corner. The car's total weight does not change — only its distribution. The amount grows with G and with CG height, and shrinks with a longer wheelbase (longitudinal) or a wider track (lateral).
For steady-state grip, yes: because of tire load sensitivity, the bigger the side-to-side load difference, the less total grip an axle produces — and lowering the CG is the most fundamental fix. Transiently, though, drivers use load transfer deliberately: braking loads the front tires and grows their friction circles before turn-in. Minimising it and exploiting it are both part of driving fast.
No. They are estimates calculated from G and your vehicle specs — longitudinal and lateral G, CG height, wheelbase, track width, and front/rear weight distribution. Because they are not measured, the display drifts from reality if the specs you enter differ from the real car.
No. The iPhone’s built-in motion sensors and GPS handle everything: G, yaw rate, roll/pitch, the load-transfer calculation, and lap timing.
In common use they mean the same thing: an instrument that displays the car’s longitudinal and lateral acceleration in units of G. Strictly, it displays acceleration rather than force. A G-G meter records those two axes on a plane.
The outer boundary of the G you reached during the session. It shows the range you actually explored, but unless you pushed to the limit in every direction it is not the physical grip limit. It is a history on a plane, mixing speed, gradient, banking, and tire condition.
The angle the body is actually leaning — not the steering angle. The “sensor” value includes road banking and tire deflection; the “approx.” value is a simplified model based on lateral G.
The time evolution of lateral G, yaw rate, and speed. Oversteer-ward means actual yaw rate exceeding the reference yaw rate; understeer-ward means yaw response fading at high lateral-G usage. Stable steady-state cornering does not trigger it. It is a caution display — not a direct measurement of tire force, steering angle, or sideslip.
Courses can be created anywhere on the map, for both closed loops and point-to-point (rally or hill-climb style) timing. However, the app is intended for competitive use in closed environments such as circuits. Never watch the screen while driving on public roads.
Currently iOS only. An Android version is in development and coming soon.
No. There is no account and no login; recordings are stored only on your device. Nothing leaves the device unless you export and share a CSV yourself.


 QUAD-G Meter