Differences in stay configuration
There are broadly two ways to mount a GT wing’s stays (supports). In the conventional type, the stays attach to the lower side of the wing surface — that is, the suction side (low-pressure surface). In the swan-neck type, the stays curve in from above and attach to the pressure side (high-pressure surface).
The fundamental difference between the two is which side of the wing the stay junction lands on. In the mechanism by which a wing generates downforce, the most important thing is the flow on the suction side (underside). The higher the flow speed and the lower the pressure there, the more downforce is generated. Whether the stays interfere with this delicate suction side is the crux of the performance difference.
Here we created two simple rear-wing CFD models and ran a comparative analysis changing only the stay configuration. From visualizations of the pressure coefficient (Cp) and skin friction (wall shear stress), we read what is happening.
How to read the pressure coefficient (Cp)
The colors displayed in the CFD result images indicate the pressure coefficient (Cp). Cp is pressure non-dimensionalized by the free-stream dynamic pressure, letting you intuitively read where on the wing surface pressure is high or low.
Red regions (Cp > 0): areas of higher pressure than the surroundings. They appear where the flow decelerates, near stagnation points, and spread over the wing’s upper surface (pressure side).
Blue-to-purple regions (Cp < 0): areas of lower pressure than the surroundings. These are where the flow accelerates and suction occurs, appearing on the wing’s underside (suction side).
The deeper the purple, the larger the magnitude of Cp — meaning stronger negative pressure and a greater contribution to downforce.
Comparing Cp distributions ── the difference by stay configuration
Swan-neck ── suction side / pressure side
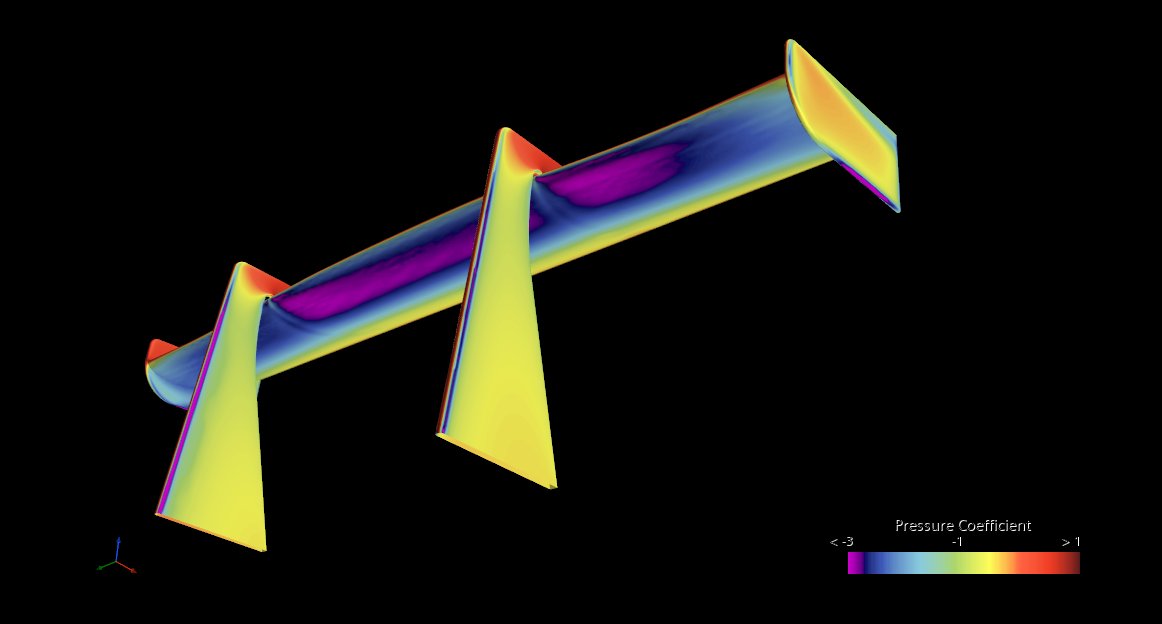
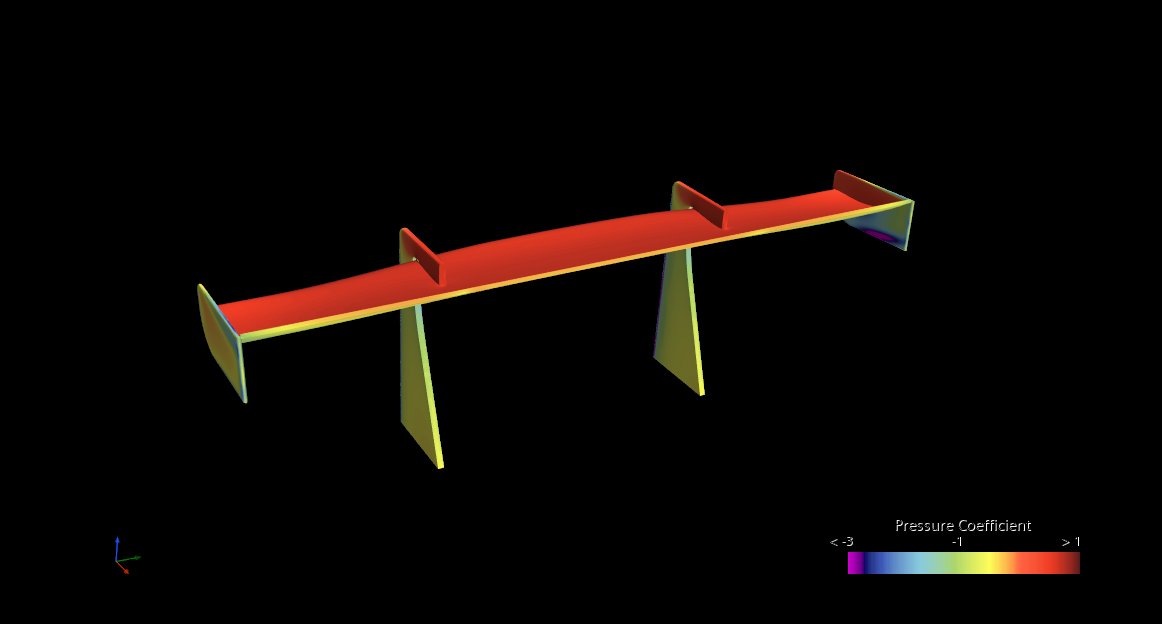
In the swan-neck configuration, the stays attach to the pressure side (upper surface). Looking at the suction side (underside), deep purple spreads across the entire wing surface, showing that strong negative pressure near a Cp of −3 is distributed uniformly along the span. With no interference from the stays, the suction-side flow is undisturbed, and the airfoil can fully deliver its inherent aerodynamic performance.
The pressure side (upper surface), on the other hand, is almost entirely red, showing positive Cp. The stay junction is on the upper surface, but because that region originally has low flow speed and high pressure, the adverse effect of the stays’ presence is kept relatively small.
Conventional ── suction side / pressure side
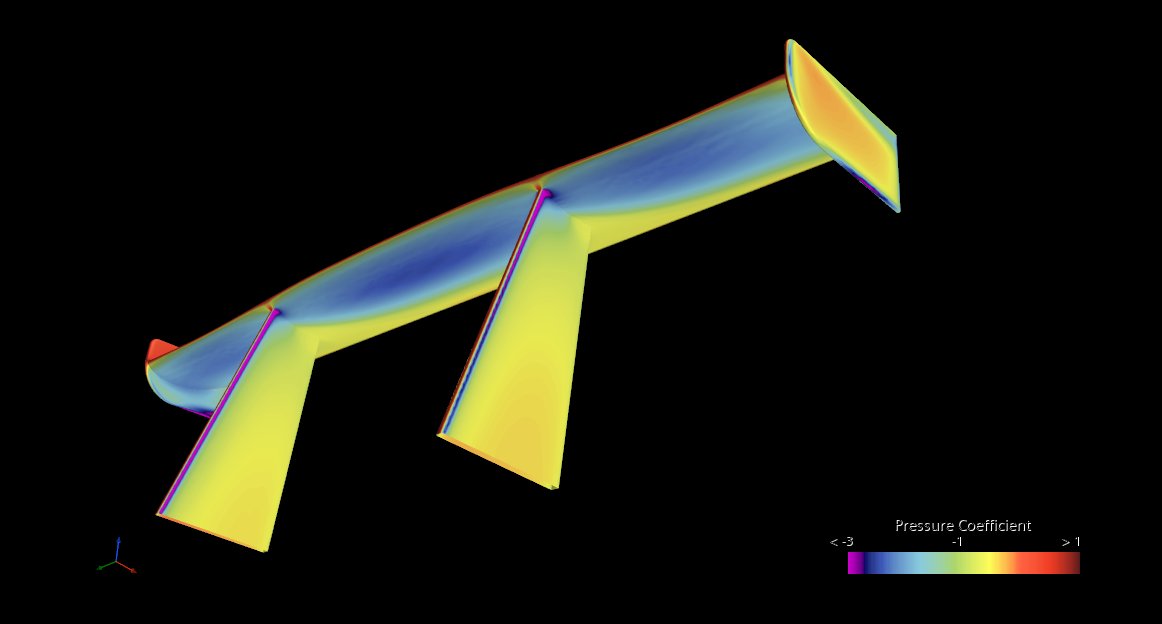
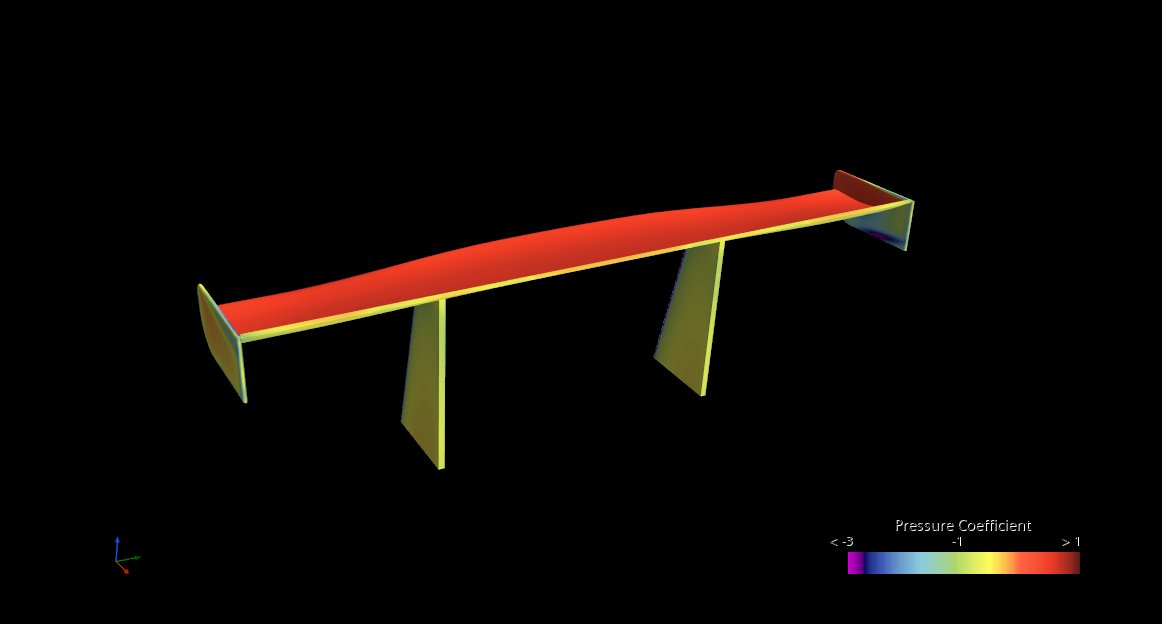
In the conventional configuration, the stays attach directly to the suction side (underside). Looking at the suction-side Cp distribution, compared with the swan-neck it is less purple, staying blue overall. In particular, the negative Cp weakens around the stay junctions, degrading the negative-pressure region that is the source of downforce.
The pressure side (upper surface), free of stay interference, shows a red distribution almost identical to the swan-neck. In other words, the difference is purely in suction-side performance, and the influence of the stay junction position appears plainly.
Why performance drops at the stay junction
The junction where a stay crosses the wing surface is, in effect, a T-shaped intersection. This geometry meets the fluid-dynamic conditions for a thick boundary layer to develop.
When a stay stands perpendicular to the main flow, a horseshoe vortex forms ahead of it. This vortex structure thickens the wing’s boundary layer and causes local deceleration and a pressure rise. As a result, a low-energy wake forms behind the stay, and in that region the flow can no longer stay attached to the wing surface, reducing suction.
Moreover, this low-energy region tends to spread downstream, its area of influence widening toward the trailing edge. Because a wing’s performance is determined by the integral of the pressure difference over the whole surface, a large low-energy region on the suction side means a direct loss of downforce.
The whole picture including the car body
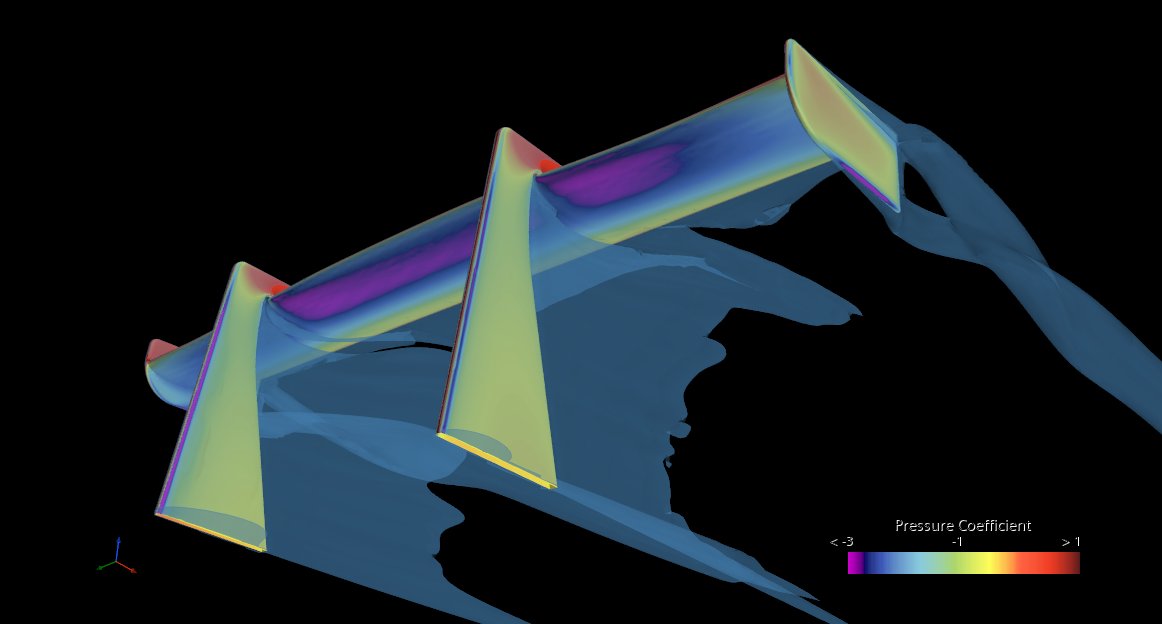
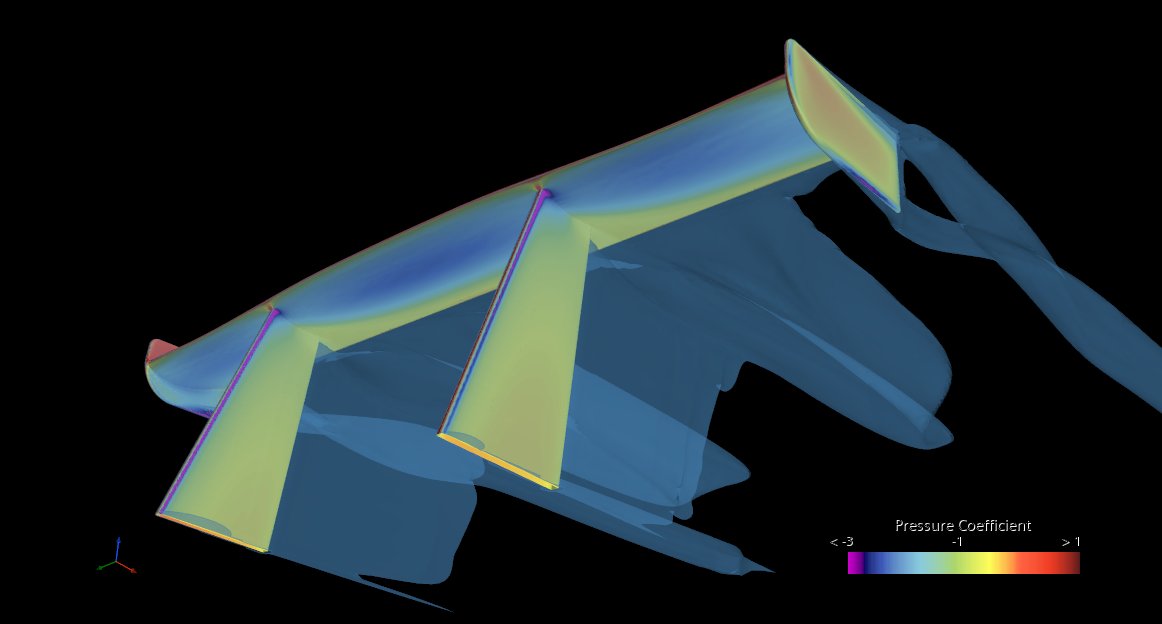
Comparing the full views including the car body, the swan-neck configuration clearly shows a strong purple negative-pressure region on the suction side, whereas in the conventional configuration the suction-side color is shallow overall, and the performance drop originating at the stay junctions can be seen spreading in the spanwise direction as well.
Skin friction ── reading the growth of separation
In addition to the pressure coefficient (Cp), visualizing skin friction (wall shear stress) lets us grasp the state of the flow on the wing surface in more detail. Skin friction is proportional to the fluid’s velocity gradient at the wall: it is high (warm colors) where the flow runs smoothly along the wall and low (cool colors) where the flow decelerates or separates.
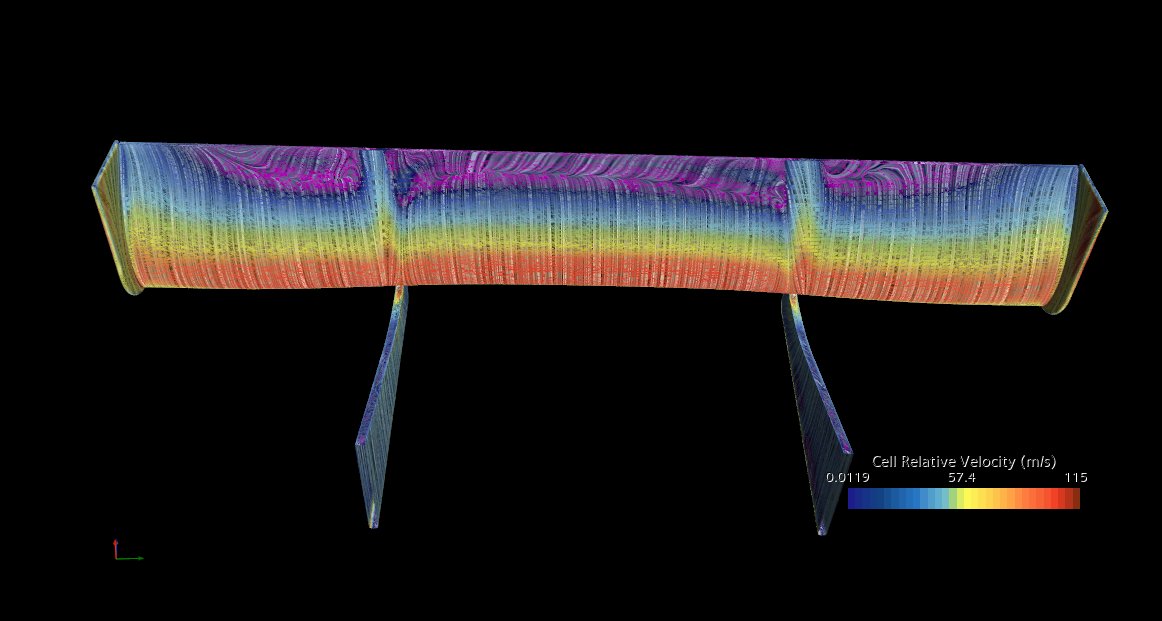
Looking at the swan-neck skin-friction distribution, the upper half of the wing surface (toward the leading edge) maintains high wall velocity in red to yellow, showing that the flow is firmly attached to the surface. A natural transition of decreasing velocity toward the trailing edge (blue to purple) is visible, but this is the airfoil’s inherent pressure-recovery process and is roughly uniform across the span.
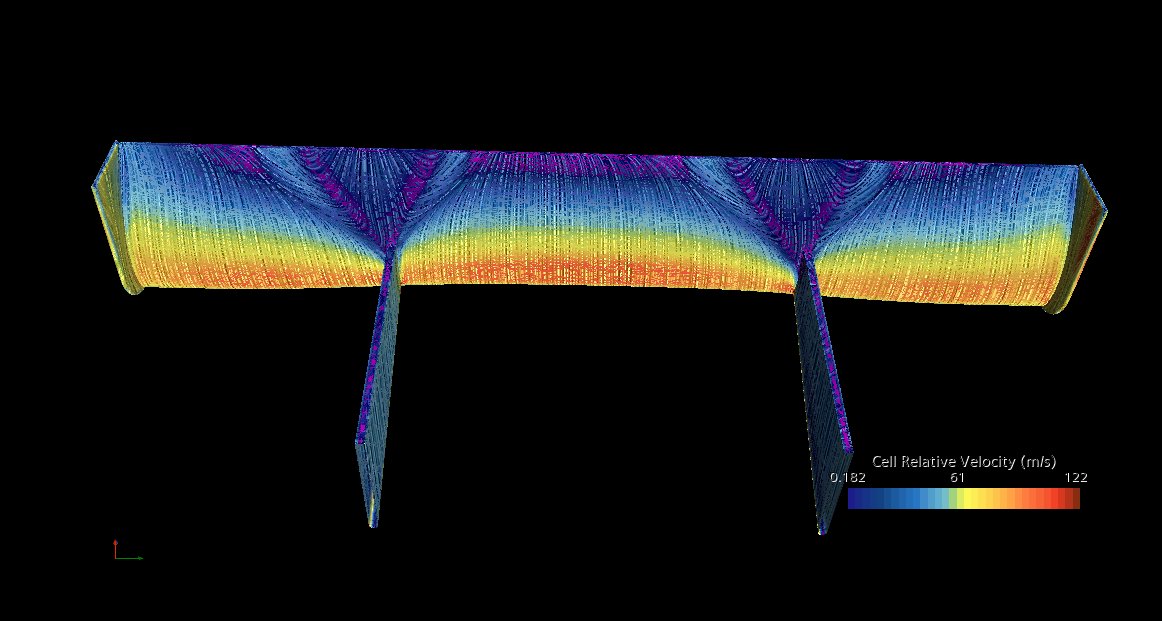
In the conventional configuration, by contrast, it is clearly visible that a purple low-speed region fans out from behind the stay junctions. This shows that the boundary layer developed by the stays expands downstream, producing large-scale flow deceleration — or a state close to separation — over the rear of the wing surface. In this model with three stays, a low-energy region spreads from each of the three stays, and they interfere with one another to degrade the performance of the entire suction side.
The delicacy of the suction side: A wing’s suction side is a region where the flow accelerates greatly and pressure drops sharply. When an obstacle (a stay) is placed within this steep pressure gradient, its impact is amplified beyond the mere size of the stay itself. A small disturbance in the boundary layer can grow into large separation downstream — that is how sensitive the suction side is.
Summary
The swan-neck configuration is a design philosophy that protects the suction-side (underside) flow by moving the stay junction to the pressure side (upper surface). This CFD analysis confirmed the following points.
In the Cp distribution, the swan-neck’s suction side maintains strong, spanwise-uniform negative pressure, whereas in the conventional case the negative pressure weakens behind the stays. In the skin-friction distribution, a large low-energy region expands on the conventional suction side, with pronounced boundary-layer growth and flow deceleration originating at the stay junctions. It was also confirmed that placing stays on the pressure side has only a limited adverse effect on performance.
The reason modern high-performance racing cars such as GT3, LMDh and Super GT adopt the swan-neck configuration is precisely this clear aerodynamic benefit of protecting the suction side. If the cost and structural constraints can be tolerated, the swan-neck is an effective option for maximizing wing performance.
← Back to blog list